
Pierson_Moskowitz
Defines the Pierson Moskowitz spectra in the wave-frequency domain
Interface
#include <codecogs/engineering/fluid_mechanics/waves/spectra/pierson_moskowitz.h>
using namespace Engineering::Fluid_Mechanics::Waves::Spectra;
double PM_Gnnw_U(double w, double U, double alpha=0.0081, double beta=1.25)double PM_Gnnw_wp(double w, double wp, double alpha=0.0081, double beta=1.25)double PM_Gnnw(double w, double wp, double alpha=0.0081, double beta=1.25)double PM_Gnnw_Tp(double w, double Hs, double Tp)double PM_Gnnw_Tz(double w, double Hs, double Tz)double PM_wind_to_wp(double wind)double PM_wind_to_Tp(double wind)double PM_Tp_to_alpha(double Hs, double Tp)double PM_Tz_to_alpha(double Hs, double Tz)double PM_Tz_to_Tp(double Tz)double PM_Gnnk_wp(double k, double wp, double depth=0, double alpha=0.0081, double beta=1.25)double PM_Gnnk(double k, double wp, double depth=0, double alpha=0.0081, double beta=1.25)
Overview
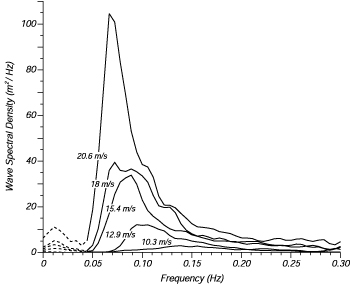
The Pierson-Moskowitz (PM) spectra is an empirical relationship that defines the distribution of energy with frequency within the ocean.
Developed in 1964 the PM spectrum is one of the simplest descriptions for the energy distribution. It assumes that if the wind blows steadily for a long time over a large area, then the waves will eventually reach a point of equilibrium with the wind. This is known as a fully developed sea. Pierson and Moskowitz developed their spectrum from measurements in the North Atlantic during 1964, and presented the following relationship between energy distribution and wind:
This can be generalised by:
where
is a numerical constant =0.0081
is a numerical constant =0.74
- g is gravity
is the wind speed at 19.4m above the sea surface.
References
- http://oceanworld.tamu.edu/resources/ocng_textbook/chapter16/chapter16_04.htm
- Massel, S.R. 1996. Ocean Surface Waves: Their Physics and Predictions. Advanced Series on Coastal Engineering. 11. London
Standards
- These functions conform to British Standards (BS 6349-1:2000), 24 July 2003.
- These functions conform to European ISO standards 19901-1:2005
FUNCTION
PM_Gnnw_U
The original generic PM spectra, defined by wind speed:
Parameters
Interactive Calculator
Computing…
Set a range above first to export a graph.
FUNCTION
PM_Gnnw_wp
The PM spectra defined by a spectral peak frequency ():
where
For a range of typical north sea conditions (where α =0.0081 and =0.5), but with varying peak enhancements the PM spectra has the form \graph w=0:1.4 wp=0.5:0.8:4
Parameters
Interactive Calculator
Computing…
Set a range above first to export a graph.
FUNCTION
PM_Gnnw
Interactive Calculator
Computing…
Set a range above first to export a graph.
FUNCTION
PM_Gnnw_Tp
The PM spectra defined by the significant wave height () and the peak wave period (
)):
For sea state with , \graph w=0:2 Hs=4 Tp=10:6:3
Parameters
Interactive Calculator
Computing…
Set a range above first to export a graph.
FUNCTION
PM_Gnnw_Tz
The PM spectra defined by the significant wave height () and the zero crossing period (
)):
For sea state with , \graph w=0:2 Hs=4 Tz=10:6:3
Parameters
Interactive Calculator
Computing…
Set a range above first to export a graph.
FUNCTION
PM_wind_to_wp
The peak frequency of the PM spectrum is based empirically on wind speed,
where
The relationship between wind speeds at different elevations are given by the expression
i.e. is equivalent to
Parameters
Returns
Interactive Calculator
Computing…
Set a range above first to export a graph.
FUNCTION
PM_wind_to_Tp
Converts wind speed to peak wave period:
where is defined by (#5).
Parameters
Returns
Interactive Calculator
Computing…
Set a range above first to export a graph.
FUNCTION
PM_Tp_to_alpha
Returns a factor that provides a linear scaling of the wave energy within both the PM and JONSWAP spectra:
where
is the significant wave heights (m)
is the peak wave period (s)
Parameters
Interactive Calculator
Computing…
Set a range above first to export a graph.
FUNCTION
PM_Tz_to_alpha
Returns a factor that provides a linear scaling of the wave energy within both the PM and JONSWAP spectra:
where
is the zero crossing wave period (s)
Parameters
Interactive Calculator
Computing…
Set a range above first to export a graph.
FUNCTION
PM_Tz_to_Tp
Returns the zero crossing wave period () associated with the peak wave period (
). The relationship between these periods comes from:
which reduces to
or
where
Parameters
Returns
Interactive Calculator
Computing…
Set a range above first to export a graph.
FUNCTION
PM_Gnnk_wp
This function uses the description of the PM spectra described in frequency to obtain an estimate of the distribution in wave-number using the 1st order dispersion relationship give in Dispersion.
This conversion is thus
where in deep water
and in shallow water
For a range of north sea conditions (where α =0.0081 and =0.5), but with varying peak enhancements the PM spectra has the following form in wave-number: \graph k=0:0.1 dk=0.01 wp=0.5 alpha=0.0081
Parameters
Interactive Calculator
Computing…
Set a range above first to export a graph.
FUNCTION
PM_Gnnk
Interactive Calculator
Computing…
Set a range above first to export a graph.