
Linear
Calculates the linear regression parameters and evaluates the regression line at arbitrary abscissas
Interface
#include <codecogs/maths/approximation/regression/linear.h>
using namespace Maths::Approximation::Regression;
Overview
Linear regression is a method to best fit a linear equation (straight line) of the form to a collection of points
, where
is the slope and
the intercept on the
axis.
The algorithm basically requires minimisation of the sum of the squared distance from the data points to the proposed line. This is achieved by calculating the derivative with respect to a and b and setting these to zero.
Let us define the following
Then the slope is
the intercept on the Y axis
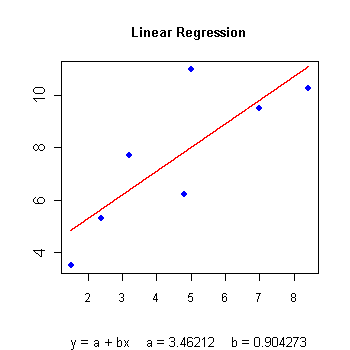
Below you will find the regression graph for a set of arbitrary points, which were also used in the forthcoming example. The regression line, displayed in red, has been calculated using this class.
Example 1
The following example displays the slope, Y intercept and regression coefficient for a certain set of 7 points.
#include <codecogs/maths/approximation/regression/linear.h>
#include <iostream>
#include <iomanip>
using namespace std;

int main()
{
    double x[7] = { 1.5, 2.4, 3.2, 4.8,  5.0, 7.0,  8.43 };
    double y[7] = { 3.5, 5.3, 7.7, 6.2, 11.0, 9.5, 10.27 };

    Maths::Regression::Linear A(7, x, y);

    cout << "    Slope = " << A.getSlope() << endl;
    cout << "Intercept = " << A.getIntercept() << endl << endl;

    cout << "Regression coefficient = " << A.getCoefficient() << endl;

    cout << endl << "Regression line values" << endl << endl;
    for (double i = 0.0; i <= 3; i += 0.6)
    {
        cout << "x = " << setw(3) << i << "  y = " << A.getValue(i);
        cout << endl;
    }
    return 0;

}
Output:
Slope = 0.904273
Intercept = 3.46212

Regression coefficient = 0.808257

Regression line values

x =   0  y = 3.46212
x = 0.6  y = 4.00469
x = 1.2  y = 4.54725
x = 1.8  y = 5.08981
x = 2.4  y = 5.63238
x = 3 y = 6.17494Members of Linear
CLASS METHOD
Linear
Initializes the class by calculating the slope, intercept and regression coefficient based on the given constructor arguments.
Parameters
The slope should not be infinite.
CLASS METHOD
getValue
Parameters
CLASS METHOD
getSlope
CLASS METHOD
getIntercept
CLASS METHOD
getCoefficient
The regression coefficient indicated how well linear regression fits to the original data. It is an expression of error in the fitting and is defined as:
This varies from 0 (no linear trend) to 1 (perfect linear fit). If and
, then r is considered to be equal to 1.
CLASS METHOD
Linear_once
This function implements the Linear class for one off calculations, thereby avoid the need to instantiate the Linear class yourself.
Example 1
The following graph fits a straight line to the following values:
x = 1  y = 0.22
x = 2  y = 0.04
x = 3  y = -0.13
x = 4  y = -0.17
x = 5  y = -0.04
x = 6  y = 0.09
x = 7  y = 0.11
\graph n=7 x="1 2 3 4 5 6 7" y="0.22 0.04 -0.13 -0.17 -0.04 0.09 0.11" a=1:7 .input