
Critical Temperature and Pressure
Definitions
Working substance (WS). The WS is used as the carrier for heat energy. The state of the WS is defined by the values of its properties, e.g. pressure, volume, temperature, internal energy, enthalpy. These properties are also sometimes called functions of state.
<br/>
Key facts
The critical temperature ($T_C$) of a WS is the temperature at and above which vapours of that WS cannot be liquefied, no matter how much pressure is applied.
The critical pressure ($P_C$) of a WS is the pressure required to liquefy the WS at its critical temperature.
<br/>
Constants
An introduction to the critical temperature and the critical pressure of a working substance.
In order to introduce the critical temperature and pressure of a working substance (WS), consider the pressure - volume ($P-V$) plot diagramed in Figure 1, which highlights the change in volume with the application of pressure for a fixed mass of gas, found at different constant temperatures. The various curves thus obtained (also called isotherms) are represented in Figure 1 in blue.
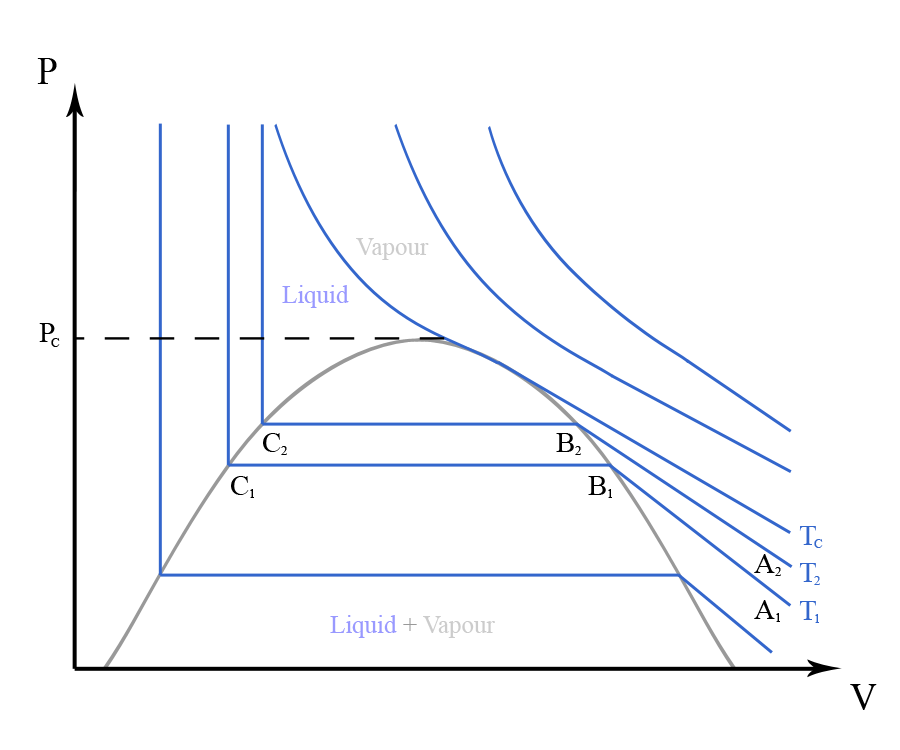
Consider for example, the $T_1$ isotherm. When initially found at low pressures (point $A_1$), the WS is gaseous. In addition, over the $A_1-B_1$ interval, the WS generally exhibits the characteristics of a gas. At point $B_1$, the WS is found at saturation, as any slight increase in pressure will result in a change from the vapour state to the liquid state. Afterwards, over the $B_1-C_1$ interval, the WS can be found as a mix of both vapour and liquid states. Also over the $B_1-C_1$ interval, the pressure is virtually constant, while the volume is decreasing. At point $C_1$, the WS is found entirely in a liquid state. From point $C_1$, the graph becomes almost vertical, indicating that a significant further application of pressure leads to a very little change in volume (as expected, as liquids are virtually incompressible).
Consider now the $T_2$ isotherm. As can be seen from Figure 1, the $T_2$ isotherm follows a path which is very similar to that of the $T_1$ isotherm. However, the $B_2-C_2$ interval is smaller than the corresponding $B_1-C_1$ interval. This indicates that the properties of the liquid and gas states of the WS are becoming increasingly similar, leading to a point where they will coincide. This point is indeed reached for the $T_C$ isotherm, which does not show any horizontal discontinuity.
Note: The locus of all the $A$ and $B$ pairs corresponding to all the isotherms constructs the gray curve highlighted in Figure 1.
The $T_C$ temperature is called the critical temperature, while the corresponding pressure is called the critical pressure ($P_C$). As can be seen from Figure 1, the critical temperature of a WS is the temperature at and above which vapours of that WS cannot be liquefied, no matter how much pressure is applied. The critical pressure is, in turn, the pressure required to liquefy the WS at its critical temperature.
Every WS has its own characteristic critical temperature and pressure. For example, for air: $T_{C,air}=-220^\circ F$, and $P_{C,air}=573 \; psi$, while for water: $T_{C,water}=706^\circ F$, and $P_{C,water}=3200 \; psi$.
Now consider the same process as in Figure 1, but this time plotted on a temperature ($T$) - entropy ($S$) diagram (see Figure 2A). The various curves obtained for the different constant pressures (also called isobars) are represented in blue.
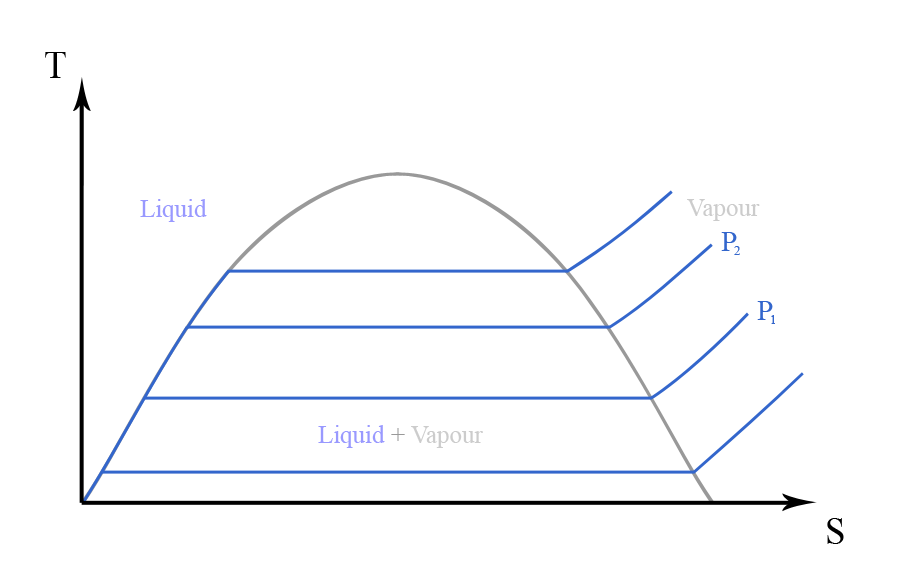
Consider for example the $P_1$ isobar. The enthalpy corresponding to this constant pressure, $H_1$, can be calculated as the area under the $P_1$ isobar, limited by $T_1$ and $S_1$ (the blue shaded area in Figure 2B).
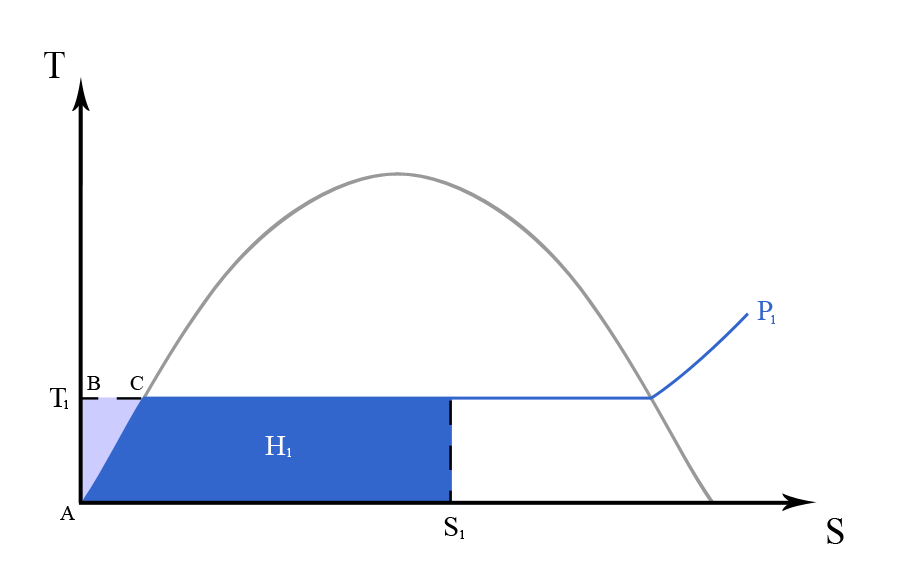
However, this area can also be calculated as:
where $\mathcal{A}_{ABC}$ is the light blue shaded area in Figure 2B.
Now imagine another isobar, $P_2$. Similarly, the corresponding enthalpy $H_2$ can be calculated as the area under the $P_2$ isobar, limited by $T_2$ and $S_2$ (the blue shaded area in Figure 2C).
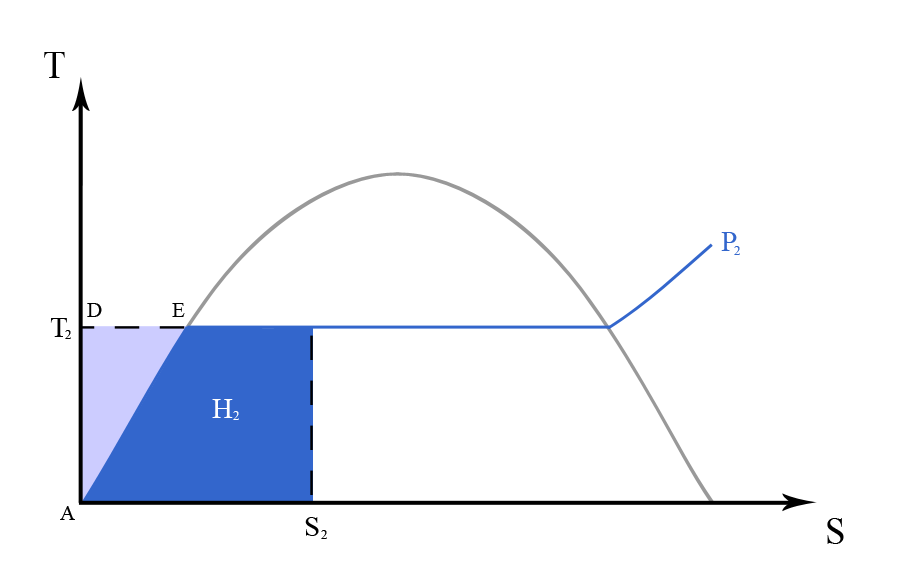
However, this area can also be calculated as:
where $\mathcal{A}_{ADE}$ is the light blue shaded area in Figure 2C.
From equations (5) and (6), the change in enthalpy becomes:
which can also be written as:
where $G$ is the Gibbs free energy ($G$ is tabulated for most WS).