
Critical Temperature and Pressure
Looks at the Function of State of the Working Substance
You're viewing an older version of this page (#3376). View the current version.
The Properties of The Working Substance.
As it is very unusual to have a Solid Working Substance, this section will confine itself to Liquids and gases( Vapours) The following Properties of State will be considered:-
- Pressure P.
- Volume V.
- Temperature T
- Internal Energy E.
- Enthalpy H.
- Entropy
The P V Diagram
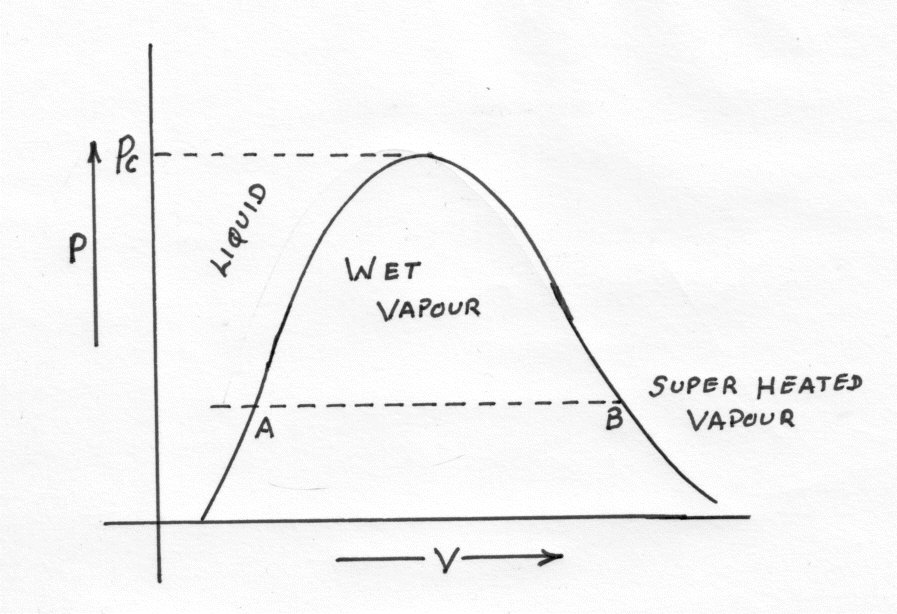
A is the Volume of liquid at it's Boiling Point and Atmospheric Pressure.
B is the Volume of Dry Saturated Vapour at it's Boiling Temperature.
NOTE The Boiling Temperature can be called the Saturation Temperature.
If a number of different isothermal lines are drawn at different Pressures there will be a number of different values for A and B. The locus of these points constructs the curve on the above graph.
The Pressure where A B = 0 is called the Critical Pressure and the horizontal line from this point to the Curve is the Critical Temperature Line.
Vapours lie in the area of the Graph bordered by the Critical Temperature line and the Dry Saturated Vapour Line. The Substance in this area can be liquified by pressure alone. To liquify a gas it's temperature must first be lowered.
The Temperature Entropy Diagram.
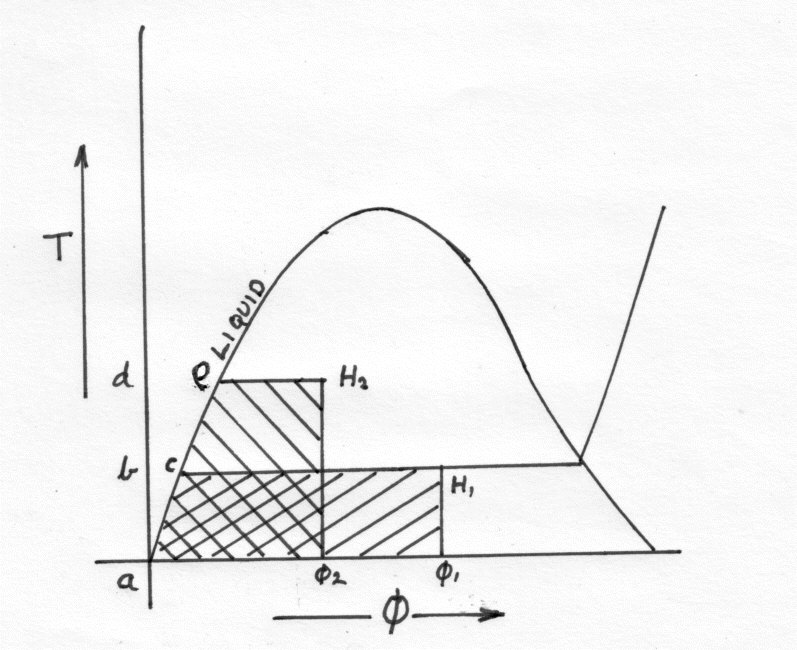
If a gas is heated at Constant Pressure then the Heat Supplied equals the gain in Enthalpy. The area under the Constant Presure Line represents the gain in Enthalpy.
If Enthalpy is zero when the Temperature is zero ( Absolute)
= Area \\\\
= Area /////
= \\\\ - /////
Where G is the Gibbs Function which is tabulated for most Working Substances