
Parabolic
Approximates an arbitrary function using parabolic least squares fitting.
You're viewing an older version of this page (#94). View the current version.
Interface
#include <codecogs/maths/approximation/regression/parabolic.h>
using namespace Maths::Approximation::Regression;
Overview
This class approximates an arbitrary function using a polynomial of degree 2, which makes it more suitable for approximating parabola-shaped graphs.
The algorithm finds the coefficients a, b and c such that the following quadratic function fits the given set of points with a minimum error, in terms of leasts squares minimization
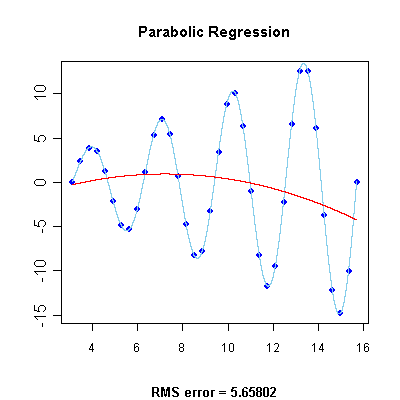
Below you will find the regression graph for a set of points obtained by evaluating the function , displayed in light blue, at particular abscissas. The regression quadratic, displayed in red, has been calculated using this class. The root mean squared error is also displayed.
References
- Jean-Pierre Moreau's Home Page, http://perso.wanadoo.fr/jean-pierre.moreau/
- F.R. Ruckdeschel, "BASIC Scientific Subroutines", Vol. II, BYTE/McGRAWW-HILL, 1981
Example 1
The following example displays 10 approximated values (you may change this amount through the N_out variable) for the given function with abscissas equally spaced in the
interval. The X and Y coordinate arrays are initialized by evaluating this function for N = 12 points equally spaced in the domain from
to
.
#include <codecogs/maths/regression/parabolic.h>

#include <cmath>
#include <iostream>
#include <iomanip>
using namespace std;

#define PI  3.1415926535897932384626433832795
#define N   12

int main()
{
    // Declare and initialize two arrays to hold the coordinates of the initial data points
    double x[N], y[N];

    // Generate the points
    double xx = PI, step = 4 * PI / (N - 1);
    for (int i = 0; i < N; ++i, xx += step) {
        x[i] = xx;
        y[i] = sin(2 * xx) * xx;
    }

    // Initialize the regression approximation routine with known data points
    Maths::Regression::Parabolic A(N, x, y);

    // Interrogate the regression function to find approximated values
    int N_out = 10;
    xx = PI, step = (3 * PI) / (N_out - 1);
    for (int i = 0; i < N_out; ++i, xx += step) {
        cout << "x = " << setw(7) << xx << "  y = ";
        cout << setw(11) << A.getValue(xx) << endl;
	}
    return 0;
}
Output:
x = 3.14159  y =   0.0202138
x = 4.18879  y =    0.196758
x = 5.23599  y =    0.313613
x = 6.28319  y =    0.370778
x = 7.33038  y =    0.368253
x = 8.37758  y =    0.306039
x = 9.42478  y =    0.184135
x =  10.472  y =  0.00254086
x = 11.5192  y =   -0.238743
x = 12.5664 y = -0.539716Members of Parabolic
CLASS METHOD
Parabolic
Initializes the necessary data for following evaluations of the quadratic.
Parameters
CLASS METHOD
Parabolic
Class destructor (empty)
CLASS METHOD
getValue
Returns the approximated ordinate at the given abscissa.
Parameters
CLASS METHOD
get_a
Returns the free coefficient a of the fitting function.
CLASS METHOD
get_b
Returns the second coefficient b of the fitting function.
CLASS METHOD
get_c
Returns the dominant coefficient c of the fitting function.
CLASS METHOD
Parabolic_once
This function implements the Parabolic class for one off calculations, thereby avoid the need to instantiate the Parabolic class yourself.
Example 1
The following graph fits a parabola to these values:
x = 1  y = 0.22
x = 2  y = 0.04
x = 3  y = -0.13
x = 4  y = -0.17
x = 5  y = -0.04
x = 6  y = 0.09
x = 7  y = 0.11
\graph n=7 x="1 2 3 4 5 6 7" y="0.22 0.04 -0.13 -0.17 -0.04 0.09 0.11" a=1:7 .input